
Summary & key findings
Summary
For the second year, our research finds that marketing teams with account-based practices achieve better outcomes. These teams report better and more consistent financial results, and are more satisfied with their teams’ performance.
High performers are aligned with sales on cohorts of strategically chosen accounts, address buying groups rather than individual leads, and monitor these groups throughout their entire buying journeys.
However, despite their advanced strategies, account-based teams still rely on lead-based measurement practices, and this obscure the effectiveness of their ABM efforts. The persistence of these legacy practices suggests that while account-based teams are adopting new methods aligned to the Three Principles of Modern Marketing, measurement practices are more difficult to replace.
In this report, we combine data from two of our recent studies – B2B Buyer Identification Benchmark and Measurement and Attribution Study – to compare the practices of marketers who have adopted account-based practices with those that have not. Together, these studies provide an overview of current practices — from how these teams identify and target potential buyers to how they measure and report on their performance.
This report points to the types of practices account-based organizations engage in and their impact on increased financial performance.
Key findings
Account-based teams outperform others. What are they doing differently (or not)?
- There is an increasing recognition of buying groups.
- Account-based teams collect more buying signals.
- Account-based teams collect signals that indicate buying group activity.
- Account-based and non-account-based teams share a similar approach to contact identification.
- Account-based and non-account-based teams share a similar approach to account identification.
- Account-based teams measure themselves with more advanced metrics.
- Account-based teams exhibit greater tool diversity for tracking marketing performance.
- Account-based teams rely on both sourced and influenced attribution.
- Account-based teams are more likely to track marketing ROI.
- Account-based teams use advanced waterfall models.
Introduction
A crucial transformation is needed in the way B2B organizations target and engage potential buyers. This need stems from a fundamental disconnect between how buyers buy, and the strategies employed by B2B companies to attract buyers.
Central to this transformation are three core principles that define modern revenue production:
Principle 1 is that marketing and sales must focus efforts against mutually agreed-upon cohorts of accounts. These cohorts are groups of prospect accounts collectively identified as the best-fit for becoming profitable customers. This account-centric methodology, which is the backbone of account-based marketing and selling practices, should form the foundation of all B2B engagement strategies, ensuring that resources are optimized and directed toward high-potential accounts.
Principle 2 is that revenue team processes must be tuned to identify and engage buying groups, not just individuals. Purchasing in B2B is seldom a solo endeavor but rather the result of collective action by buying groups. These buying groups typically comprise about 10 members, and the size of the group depends in large part on the cost of the purchase and the number of vendors being evaluated. These large groups emit thousands of signals during their purchase journey, and these signals are the key to identifying the most likely buyers.
Principle 3 is that revenue teams must monitor buying groups from each of their targeted accounts throughout their entire buying journeys. Most buying groups (84%) have chosen a preferred vendor before they initiate direct contact with sellers, which happens more than two-thirds of the way through their journey. Monitoring the full length of buying journeys allows organizations to prioritize and align resources where they will produce the optimal outcomes.
By aligning sales and marketing efforts with these principles, B2B providers are poised to influence buying groups more effectively and win more deals.
Last year
In our 2023 exploration of these topics, we found that organizations that measured more buying group-centric aspects of their revenue production operations tended to report better financial performance. In that study, both having an ABM practice and having more ABM- and buying-group centric measurements were associated with better financial performance independently of one another. Organizations that include ABM-specific measurements in their implementation of ABM will enhance their performance above and beyond the benefits they receive from having an ABM practice.
The ABM measures we asked about this year still lagged well behind ABM adoption. In other words, organizations are still adopting ABM strategies well in advance of adopting the measures that would indicate how well those strategies are working. For example, when a program’s success is predicated on producing more opportunities and revenue from a specific set of accounts, we would expect virtually all ABM practitioners to measure opportunities and revenue produced from those accounts. Again this year, that is not what we found. This misalignment undoubtedly leaves organizations struggling to comprehend and perpetuate the value of their ABM programs.
Who is doing ABM?
Across the two studies, sixty-four percent of marketers said that their teams have an account-based (ABM) or target account approach. While there are a wide variety of definitions of ABM, the critical factor we wanted to account for is adoption of Principle 1, aligning marketing and sales on a common set of accounts.
We found that adoption is relatively consistent across the industries we sampled – between 57% and 67% of marketing teams in Professional Services, Business Services, Financial Services, Manufacturing, and Technology have an account-based program. The minor differences we observed within this 10% range did not achieve statistical reliability, allowing us to infer that marketers in these industries are adopting ABM at statistically comparable rates.
ABM adoption in privately financed companies lags behind companies with other funding structures. Fifty-three percent of these teams have adopted ABM compared to 60%+ among companies with venture-capital, private-equity, or publicly traded funding.
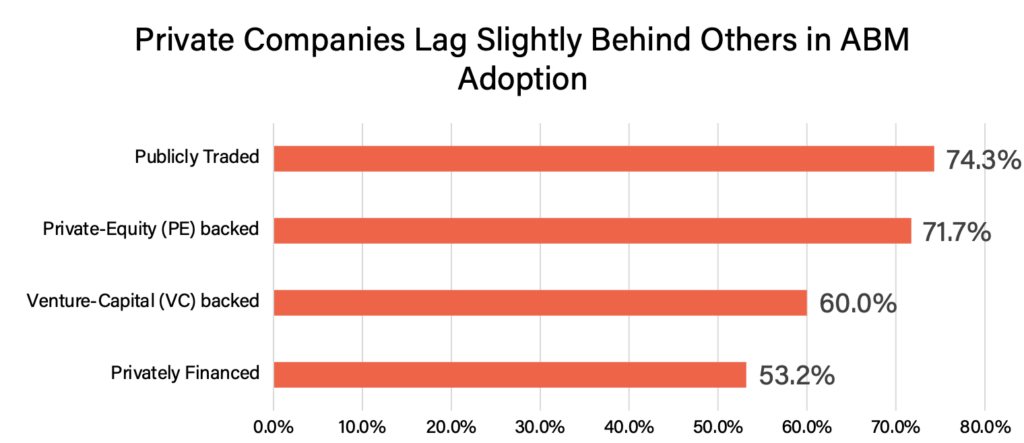
Small organizations – those measuring their annual revenue in hundreds of thousands – also fall behind in ABM adoption by about 10% or more. About 40% of these smaller organizations are also privately funded companies.

Surprisingly, organizations that sell to larger companies are not more likely to adopt ABM. One of the key reasons companies adopt account-centric marketing and selling practices is that larger accounts tend to represent multiple selling opportunities. We would expect to see higher adoption rates among teams selling to larger segments.

What type of ABM programs are marketers adopting?
There are three main types of ABM strategies teams can adopt. The definitions provided below are guidelines, but there are no strictly observed standards.
- One-to-one ABM: Revenue team resources are assigned to each account, and each is targeted with programs and tactics tailored to each account’s unique needs and characteristics.
- One-to-few ABM: Marketers target a somewhat larger cohort of similar accounts, where each account is named and where marketing, sales, and customer success resources are dedicated to each account. Programs and tactics are for tailored for the accounts, but resource coverage is thinner than for accounts in the one-to-one cohort.
- One-to-many ABM: Revenue teams target clusters or segments of accounts with shared characteristics, such as their industry, region, or size. Messaging and tactics are customized to the segment, but not to the specific accounts.
The figure below represents the proportion of marketers with an ABM practice that engage in each type of ABM. For example, the most common type of ABM practice is one-to-few. Nearly 20% of teams employ more than one type of ABM.
Account-based teams out-perform others
Account-based marketing programs are associated with better financial performance
In all our surveys, we ask how well respondents’ companies performed financially over the past year on a five-point scale from “well below expectations” to “well above expectations”. Like last year, marketers on teams with account-based programs told us that their organizations performed reliably better than did marketers with no ABM practice.
In our Measurement and Attribution Survey, we found that organizations with ABM practices also tended to experience less variability in their performance. Using a common measure of how much respondents’ answers varied from one another, ABM practitioners had a Coefficient of Variation (CV) of 15% (considered “small” in statistics), compared to 21% for non-account-based teams (considered “moderate”). Our recent Buyer Identification Study survey produced a similar finding, but that difference did not rise to statistical reliability (18% for ABMers v 20% for non-ABMers).
In simple terms, this means account-based marketers not only rate their financial performance higher on average, but their ratings are also more consistent. Non-account-based teams show a wider range of performance ratings, indicating less consistency in financial outcomes.

Having An ABM Practice Associated with Financial Performance

Marketers using account-based programs report higher satisfaction with performance metrics
In our Measurement and Attribution Study, we asked marketers to rate the fairness of their organization’s measurement practices. Marketers rated fairness on a scale from 1 (unfair) to 5 (fair). Here, we found that teams with account-based programs reliably rate their organizations as more fair. Although a better outcome for account-based marketers, it is notable that the difference is relatively small, and that both scores are below four (somewhat fair) on our five-point scale. In general, marketers don’t love the way they are measured.

Ten things account-based teams are doing differently (or should be)
Thus far, we’ve seen that organizations with account-based practices outperform their non-account-based peers on both our Financial Performance scale and Fair Measurement Index. In the remainder of this report, we will explore the practices of account-based teams to identify what sets them apart from others.
1. Increasing recognition of buying groups among account-based marketers
In B2B, there are two important types of content consumers. One, the curious professional, visits vendor websites out of curiosity and to remain current in the offerings of solutions that are relevant to their jobs. The second type of visitor consumes vendor website content as part of their role on an active buying group. It is impossible to tell these two content consumers apart simply by looking at their behavior. Further complicating matters, the same individual may browse out of professional curiosity at one point in time, but later engage in the same behaviors because they are part of an active buying group.
The only way to tell which content consumers are members of active buying groups is to observe whether multiple buying group members are consuming similar content at the same time. When multiple individuals from the same organization research the same solutions at the same time, that is a much more reliable indicator of an in-market. buyer. The likelihood that browsing by multiple indrepresents a legitimate selling opportunity increases with each additional visitor from the same account who engages in this behavior.
To understand if organizations see and act on this indicator, we asked whether they prioritize accounts from which they have received multiple leads. A promising 72% of organizations indicated they do prioritize accounts with multiple leads, which is up from 61% in 2022. This suggests a strong and growing awareness of the need to orient revenue generation activities around buying groups. While marketers in our sample that have an ABM program take a slight lead in prioritizing accounts with multiple leads, the difference is not statistically reliable.

2. Account-based teams collect more buying signals
As B2B buying teams comb the internet in search of solutions to their business problems, they have thousands of digital interactions. These interactions are cataloged, matched to the accounts from which they come, and are made available to B2B vendors in the form of third-party intent data. When these signals are combined with traditional signals such as form-fill leads and email and ad clicks, marketers can find themselves with a treasure-trove of signals to reliably identify in-market buyers.
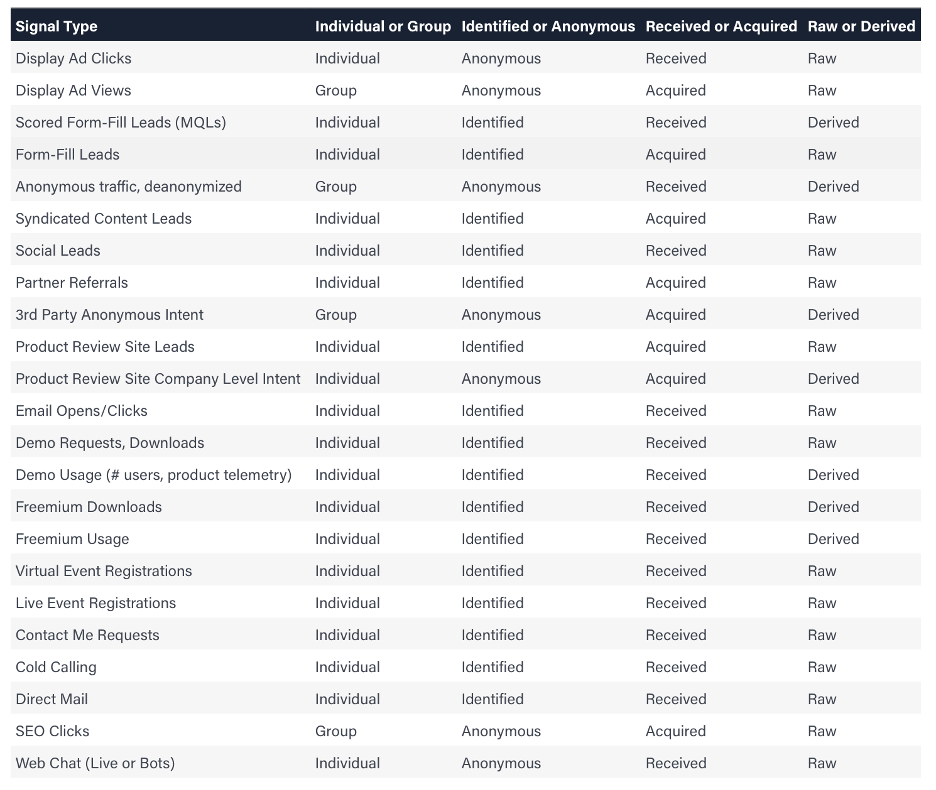
In our B2B Buyer Identification Benchmark study, we examined whether revenue teams are capitalizing on this wealth of information by asking them how many distinct buying signals, from a list of 23, they collect (see the Appendix for the list of signals we asked about). We found that marketing teams with account-based programs reliably collect more signals than their counterparts. It is also true that both groups fail to exploit even half of the available buying signals.

What account-based teams can do better
Although account-based teams set the standard by collecting more signals than teams without an ABM approach, they still only utilize 7 to 8 out of the 23 signals we inquired about. All marketers could be utilizing many more of these signals than they currently do. While there is no standard for how many is optimal, it appears that nearly all marketing organizations could do more to identify active buying groups and distinguish them from the curious professionals who browse their websites every day.
Having noted above that marketers are underutilizing available signals; we were interested to see if there were particular challenges that prevented marketers from utilizing a greater range of signal types.
It is notable that budget is no more of a challenge than time, technology, process, or skill. This suggests that the low usage rate of signal types is driven by multiple factors. Each marketing leader likely faces its own unique blend of challenges.

3. Account-based teams collect signals that indicate buying group activity
As we’ve just learned, account-based teams collect a greater variety of buying signals than their non-account-based peers.
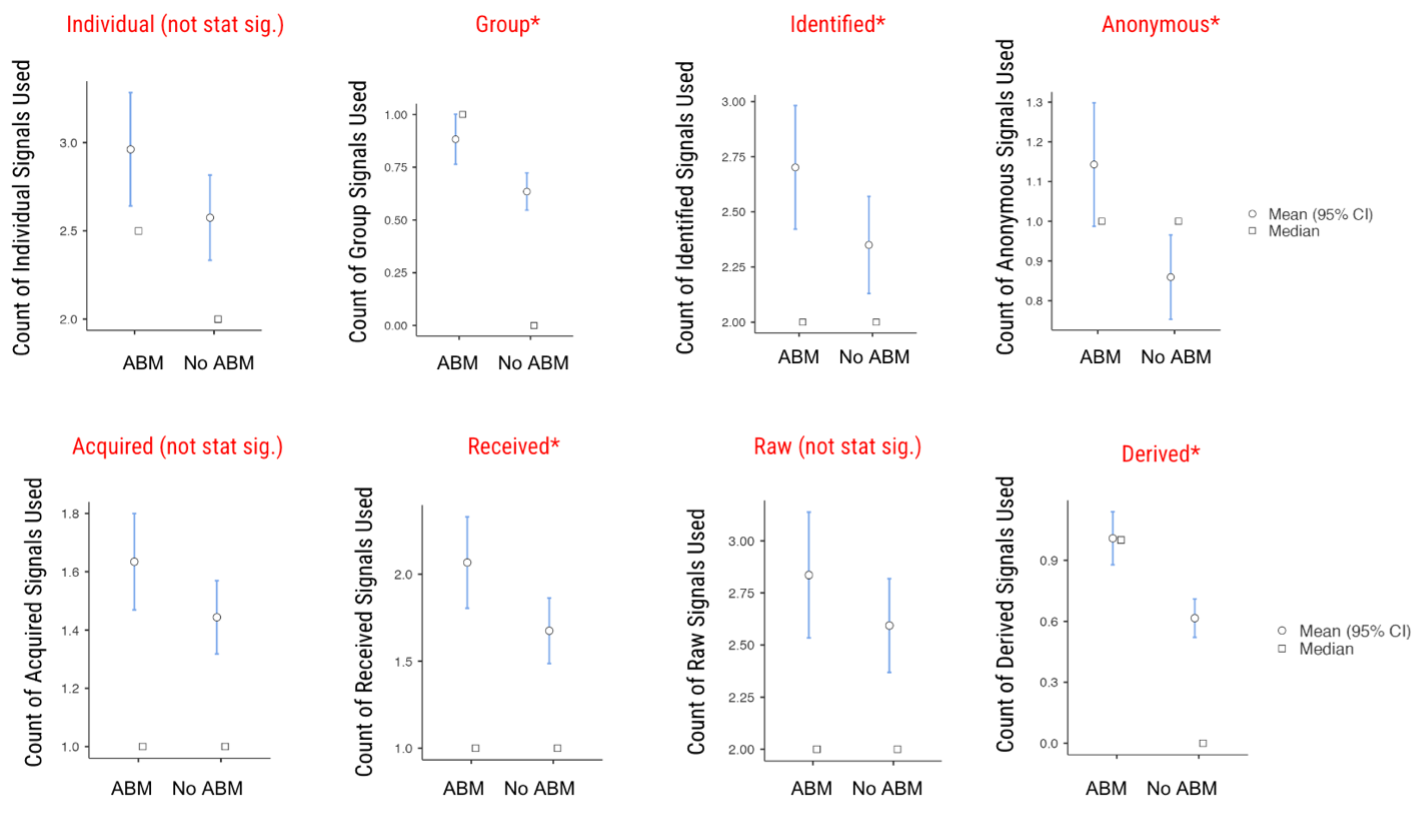
While some signals – such as form-fill leads – point to the activity of individuals who are identified by name, others – such as de-anonymized web traffic – indicate broader buying group interest (consistent with Principles 2 and 3). Likewise, some signals point to actions by groups from the same account and buying group (e.g., 3rd party intent), while others indicate the behavior of individuals (e.g., syndicated content leads).
To simplify this complexity, we categorized the 23 types of signals in our study along four dimensions. These four dimensions correspond to the type of information a signal provides. Categorizing the signals in this way enables us to better assess what marketers value in these signals (see category descriptions below).
| Raw (Legacy) | Derived (Legacy) | |
|---|---|---|
| Definition | Signals acquired and used in the form they are received (e.g., form-fill lead). | Signals that are the result of performing an operation on another signal (e.g., a form-fill to which a score has been applied to enable prioritization). |
| Average Number Collected | 5.3 signals | 1.7 signals |
| Percent Considered Useful 49% | 49% | 45% |
| Anonymous (P2, P3) | Identified (Legacy) | |
| Definition | Signals used to identify anonymous behavior (e.g., third-party anonymous intent, anonymous visitors to a website). | Signals for which the identity of the individual is known (e.g., webinar registrations). |
| Average Number Collected | 2.1 signals | 5.0 signals |
| Percent Considered Useful | 46% | 50% |
| Individual (Legacy) | Group (P2) | |
| Definition | Signal that reveal the presence or actions of a single person (e.g., form-fill, email open). | Signals that reveal group behavior (e.g., third-party intent, software review site account-level report). |
| Average Number Collected | 5.4 signals | 1.5 signals |
| Percent Considered Useful | 50% | 46% |
| Received | Acquired (P3) | |
| Definition | Signals that are received directly from provider systems (e.g., freemium downloads, form-fills). | Signals that are acquired from another party, which originally received or created the signal (e.g., syndicated content leads, third-party intent). |
| Average Number Collected | 4.1 signals | 2.9 signals |
| Percent Considered Useful | 44% | 52% |
What we found is that account-based teams utilize basic signal types — Raw and Identified, such as form-fill leads — at a similar rate as their non-account-based peers.
However, where account-based teams set themselves apart is that they are more likely to integrate signals that reveal buying group activity (consistent with Principle 2) than those without an ABM practice. They are also more likely to collect anonymous signals that are computed, such as account or intent activity scores (consistent with Principle 3). These findings, further detailed in the figure below, indicate that marketing teams with an account-based approach are more likely to seek signals that align to the Principles of Modern Revenue Generation (identify and characterize buying group activity).
What ABM teams can do better
While Account-Based marketers are more likely to use signals that reveal buying group activity, they are as likely as their peers to measure individual-level signals such as form-fill leads. So, while ABM practitioners are utilizing more advanced methods, they are clearly still in transition and still using legacy signals, as well.
4. Account-based and non-account-based teams share a similar approach to contact identification
There are no statistically reliable differences in the data that account-based and non-account-based teams use for contact identification. CRM data is the least utilized by both groups, and the other data sources listed in the figure below are used at rates that are statistically equivalent.

As with the data sources used for contact identification, account-based and non-account-based teams use the same tools to identify contacts. The only consistent trend is that ABM platforms are less frequently used compared to CDPs, spreadsheets, and predictive analytics platforms. This is expected for non-account-based teams but surprising for those with an ABM program.

What account-based teams can do better
What the data above clearly indicate is that the data organizations keep in their internal systems is not adequate to support marketing efforts. CRM and CDP systems are typically the systems of record for account and contact data, but neither are used by more than 30% of marketers to identify contacts.
5. Account-based and non-account-based teams share a similar appproach to account identification
Although CRM data is the least utilized for contact identification, it is the most popular for account identification among both account-based and non-account-based teams. It is used more frequently than any other data source we inquired about. Beyond the widespread use of CRM data for account identification, there are no other statistically reliable differences between account-based and non-account-based teams.

Once again, there are no statistically reliable differences in the tools used for account identification between account-based and non-account-based teams. Any minor apparent differences shown in the figure below do not represent statistically reliable differences. It’s worth noting that although ABM platforms were the least common tool for contact identification, they are adopted more uniformly for account identification. We also noted that both teams use ABM platforms more frequently than spreadsheets.

What account-based teams can do better
We noted in the introduction that organizations must adopt methods and practices that identify buying groups (Principle 2) and track potential opportunities throughout their lifecycles (Principle 3). Adoption of 3rd-party intent is necessary for both, but adoption sits just below 30% for both ABM and non-ABM practitioners.
6. Account-based teams measure themselves with more advanced metrics
So far, we’ve learned that organizations with account-based programs are recognizing and prioritizing accounts that have multiple leads, demonstrating alignment to Principle 1 and Principle 2. ABM practitioners are also expanding their signal mix to include those that indicate buying group activity. Still, all marketing teams that took our surveys have substantial room for improvement in the way they identify buyers, but account-based marketers are showing signs that they’re headed in the right direction.
Next, we look at how marketing teams are measuring themselves.
When marketing teams adopt specific programs, we would expect that they’re also adopting the measures that would indicate how well those programs are working. Across both studies reviewed in this report, 64% of marketers said that their teams have an account-based or target account (ABM) practice. Organizations with account-based practices should, at the very least, measure items that correspond to Principle 1, being aligned on accounts.
And because when accounts are targeted, success will include driving more engagement – both known and anonymous – from an entire buying group and not just a single individual, we would further expect that account-based marketers would be measuring items associated with Principle 2.
Finally, when an organization is staking more of their success on outcomes from a restricted set of accounts, it would behoove them to have a full accounting of where each of those potential customers is in their buying journey, Principle 3.
As shown in the figure below, ABM practitioners are much more likely to utilize measurements associated with all Three Principles than are non-ABM practitioners.


Three of the most advanced measures are the most common measures – among ABM practitioners
With 84% of buyers picking a favored vendor before talking to sales (Principle 3), it is clearer than ever that organizations must use intent data to see and react to inflight buying processes as early in their lifecycles as possible. This means identifying buyers with intent, and, of course, measuring them as they progress.
Similarly, when organizations focus efforts on a targeted set of accounts (Principle 1), it is important to measure whether opportunities, pipeline and wins are produced from them. It is also important to measure whether opportunities are lost within that targeted set of accounts. In particular, marketing should measure as carefully as possible how many deals went to competitors, which were not contested. Marketing’s goal should be to reduce and eliminate such uncontested losses.
Finally, because the buyer in B2B is a group, not an individual (Principle 2), measuring the engagement of buying groups is a far better measure of buyer engagement than is the measurement of individual engagement (e.g., leads, MQLs).
We were pleased to see that all three of these advanced metrics are used by most marketers. This represents a substantial gain over the recent past. Nearly 40% of all organizations in our sample measure all three. Individual adoption rates of these measures can be seen in the figure below.

What account based teams can do better
While teams employing ABM practices are more inclined to integrate measurements associated with all Three Principles, and especially Principle 1, most measure less than half of the Three Principle-aligned measures that are available. Account-based organizations are also just as likely as non-ABM organizations to measure lead-centric measures such as MQLs and leads produced. Furthermore, they place comparable importance on metrics aligned with the Three Principles and lead-centric metrics (see figure below). This pattern suggests that ABM organizations are still struggling to comprehend and perpetuate the value of their ABM programs.
Despite mounting evidence that prioritizing individual leads is a failed approach, marketers still lead-based outcomes above all others, even those with ABM practices.

7. Tools for tracking marketing performance: Account-based teams exhibit greater tool diversity
The average marketing team employs multiple tools to measure and report on the metrics that assess their contribution to revenue generation. Those with an ABM practice report using just over three tools while non-account-based organizations use just two.

In the figure below, you’ll find the breakout of which tools are used across organizations with and without an ABM practice. Spreadsheets, CRM systems, and Sales Engagement Platforms are the top choices among ABM teams, with each being utilized by approximately half of them. These three tools are statistically more common for ABM teams than any others we asked about.
Among those who don’t have an account-based practice, spreadsheets clearly dominate. While 53% of ABM teams use spreadsheets, a whopping 70% of those who don’t have an ABM practice rely on them. The next most prevalent tool among non-ABM practitioners are CRM systems, used by just 43.3%.

What account-based teams can do better
As we’ve just seen, account-based organizations most commonly find themselves relying on Spreadsheets, CRM systems, and Sales Engagement Platforms for measurement and reporting.
This preference underscores a greater dependency on traditional tools over ABM-specific platforms.
In our report The 2024 Marketing Attribution & Contribution Benchmark, we compared each tool with marketers’ reports on how well their organizations were doing financially. Those using spreadsheets gave lower financial ratings while teams using business intelligence and commercial attribution tools gave higher ratings. There are countless factors that influence an organization’s financial results, far beyond what we’ve covered in our study or can generally account for.
However, what this suggests is that organizations employing rudimentary tools like spreadsheets may exhibit a broader lack of sophistication that limits their performance. Put simply, organizations relying on spreadsheets might also tend to engage in less sophisticated practices. However, putting in place measurement tools that allow an accurate assessment of the performance of critical revenue generating functions should be prioritized.
Thus, while we applaud that account-based organizations are likely to rely on more than just Spreadsheets, there’s a compelling case for them to broaden their toolkit to include more sophisticated and relevant options.
8. Account-based teams rely on both sourced & influenced attribution
For more than a decade, organizations have wrestled with how to measure marketing’s impact on revenue production.
There have typically been two strategies:
Marketing sourced metrics: an attempt to identify which deals and their associated revenue were first identified or engaged through a marketing activity.
Marketing influenced metrics: an attempt to measure which deals that are not claimed as sourced by marketing, but which were nonetheless touched at some point by marketing tactics.
Both approaches are marred by subjective, dubious, and often irrelevant claims about when a deal was identified, activated, or touched by marketing.
Marketing-sourced metrics have come under increasing scrutiny in recent years for both under- and overstating marketing’s role in identifying selling opportunities.
Organizations with account-based programs equally rely on Sourced and Influenced attribution. Nearly 60% use a combination of the two, while 22% exclusively use Influenced attribution and 19% exclusively use Sourced.
Meanwhile, non-ABM organizations tend to rely more on Sourced metrics. About half (54%) of ABM practitioners use a combination of Sourced and Influenced attribution while 34% use Sourced exclusively, and just 12% use only Influenced.

9. Account-based teams are more likely to track marketing ROI
Ninety percent of our audience reported that their organizations measure marketing’s return on investment (ROI), however, as indicated in the chart below, organizations with an ABM practice are more likely to measure it than their non-account-based peers. Again, this indicates that marketers with ABM practices are likely to be more sophisticated in general.

Additionally, and not surprisingly, account-based teams are much more likely to report Program-Level ROI than are those that do not have an ABM program. This is probably because ABM is typically considered a program, and, as a program with its own budget, there is substantial scrutiny of ABM programs.

In general, account-based teams also think measuring ROI is more important to their organizations than do non-account-based teams. We also observed that Venture Capital (VC) backed companies are more likely to report marketing ROI at the program level. However, VC-backed companies are also more likely to do ABM. When we examined the two variablestogether in a logistic regression predicting the likelihood of reporting program-level ROI, only having an ABM practice increased the odds of reporting marketing ROI.


What account-based teams can do better
ABM practitioners are more likely to measure ROI than others. However, ROI is notoriously difficult to measure, and the techniques used to do so are often suspect (see the Measurement and Attribution Study ).
10. Account-based teams use advanced waterfall models
Waterfall models are structured frameworks that track a company’s relationship status with prospects. These models provide organizations with a systematic approach to track and manage the progression of selling opportunities toward close. Waterfall models vary in the definition of stages and in where they initially begin tracking prospects. Some begin when a prospect has been targeted, while others track only official sales stages.
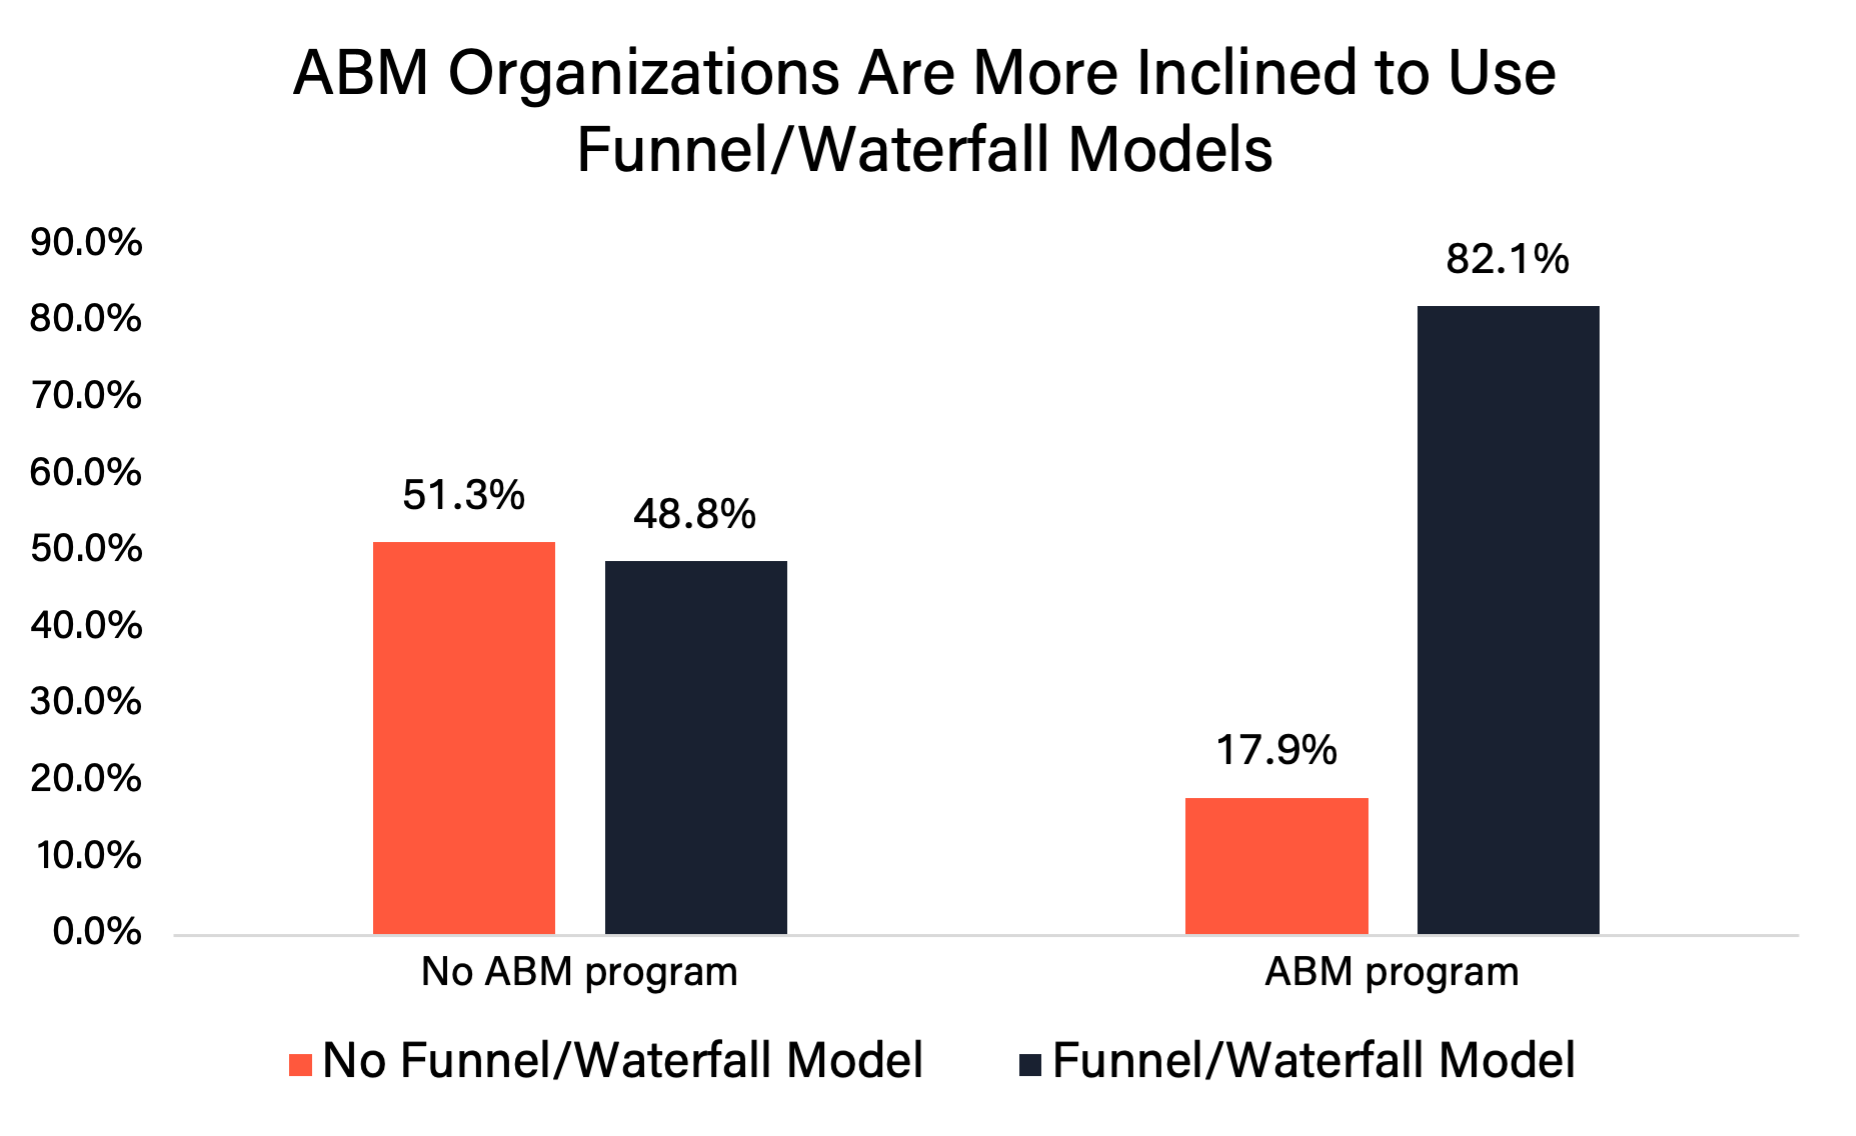
Eighty-three percent of marketers in our sample indicated that their organization employs a funnel or waterfall model incorporating pre-sales activities.

Shown in the chart below, if organizations have an account-based program, they are much more inclined to use one.
In our survey, we asked about four different Waterfall models, as described in the table below.
| Waterfall/Funnel Type | Description | Relationship to Principles 1 through 3 |
|---|---|---|
| Lead-based Waterfall | A Waterfall model that begins when an organization receives a lead. Such models track the progress of individuals through pre-sales stages until they are won or lost. | Not applicable to any |
| Sales-Only Funnel | Sales-only funnels track opportunities that have entered formal sales stages. These models track opportunities from the earliest sales stage until they are won or lost. | Not applicable to any |
| Account-based Waterfall | Account-based waterfalls track accounts through their progression to become customers. Account-based waterfalls can only be used when an account represents a single selling opportunity. These waterfalls may begin with pre-sales stages. | Applicable to Three Principles in the following conditions: Principle 1: When organizations have explicit agreement on which accounts are measured within the waterfall. Principle 2: When an organization sells only one solution and contacts may be added to accounts prior to delivery to sales Principle 3: When an organization sells only one solution and when accounts are tracked from the time relevant intent signals are detected |
| Opportunity-Based Waterfall | Opportunity-based waterfalls track selling opportunities, allowing them to be used in situations where an account represents multiple selling opportunities. Some begin as early as when potential selling opportunities are identified as Targets, while others begin at a later stage, such as when an intent signal is identified, or when contacts representing an opportunity have engaged. | Applicable to Three Principles in the following conditions: Principle 1: When organizations have explicit agreement on which accounts may have opportunities measured within the waterfall. Principle 2: When multiple contacts may be attached to opportunities prior to delivery to sales. Principle 3: When opportunities are tracked from the time relevant intent signals are detected |
Below are the four types of models are asked about and how their adoption differs between teams with and without and account-based program. Account-based marketers have a clear inclination to adopt the advanced waterfall models (account and opportunity-based) than less advanced models (leads-based and sales-only funnels).

Surprisingly, while account-based teams have a higher tendency to adopt advanced waterfall models, they give similar usefulness ratings for these models as their peers using leads-based or sales only funnels. Non-account-based marketers rate opportunity-based funnels as more useful than their peers using the other three models, despite a relatively low adoption rate (32.8%). Thus, although not widely embraced by non-account-based organizations, the minority that does utilize this advanced waterfall method can hopefully serve as a compelling demonstration of its effectiveness to their peers.

What account-based teams can do better
As we’ve just seen, although account-based teams tend to incorporate advanced waterfall models into their frameworks, they are still just as likely as their peers to also rely on basic models such as leads-based and sales-only funnels. And, they value these basic models just as highly as the advanced models. This marks the second instance in our report where account-based teams have assigned similar value to both elementary and advanced strategies. The caution here is that the pattern suggests account-based teams are not fully understanding and leveraging the benefits of their ABM programs, along with the associated practices and metrics.
Budgeting
Inbound, outbound, ABM programs are equally budgeted
Lastly, in our B2B Buyer Identification Benchmark study, we explored how teams were budgeting their go-to-market strategies. The marketers we surveyed indicated that Inbound, Outbound, and Account-Based Marketing (ABM) strategies each receive equivalent shares of organizations’ marketing budgets. According to our survey respondents, each of these strategies receive around 30% of the total marketing budget.

Implications
As many have said, account-based marketing (ABM) is just good marketing. The differences we see in how account-based practitioners identify buyers and measure their contributions underscore the differences between how ABM and non-ABM practitioners operate.
The present research, now in its second year and involving a wider and more diverse group of marketers, continues to demonstrate that account-based practices are associated with better outcomes. Marketers within account-based practices consistently report better financial performance and express greater satisfaction with the way their organizations evaluate their performance.
As we’ve seen throughout this report, these organizations tend to be more thorough with their measurement practices, including strategies, tools, and measures that:
- prioritize engagement with strategically selected accounts (Principle 1),
- focus on the entire buying group instead of individual leads (Principle 2), and,
- engage buying groups throughout their buying journey (Principle 3).
While account-based teams are leaders in this respect, the research also shows that most marketing teams’ practices need critical work. In most cases, account-based teams are simply adding frameworks aligned to the Three Principles to their existing suite of traditional practices – MQLs, Leads, unproductive attribution practices like first- and last-touch sourced metrics, and basic Waterfall Models such as leads-based and sales-only funnels. Regrettably, ABM practitioners employ these unproductive practices at the same rate as their non-account-based peers, rather than leaving behind what no longer serves them.
Moreover, account-based teams often assign similar value to both traditional practices and those associated with the Three Principle. This suggests that ABM practitioners are still in the midst of a transition from old to new practices. While account-based teams are struggling to let go of legacy practices, they are beginning to adopt procedures that align to The Three Principles of modern revenue production.
Although there is still much work to be done, it is evident that those embracing ABM are moving in the right direction. It is our hope that this report not only highlights the path that ABM practitioners are beginning to forge but also encourages full and committed participation from the broader marketing community.
Appendix
Methods
The survey sample
This report synthesizes data from two of our recent studies – the B2B Buyer Identification Benchmark and the Measurement and Attribution Study . We gathered responses from 616 B2B marketers for the Buyer Identification Benchmark survey and 716 for the Measurement and Attribution survey, totaling 1,332 participants for our combined analysis. While we’ve utilized data from all respondents where applicable, it’s worth noting that certain findings reflect study-specific participation rates. Additionally, when combining data from both studies is feasible, there may be differences in averages reported across the three reports. For instance, 83% of respondents reported practicing ABM in our Measurement Study, in contrast to 43% in the Buyer Identification Benchmark. This results in an aggregate average of 64% ABM practice as reported here. Below is firmographic information on the combined sample.


Buying signal types and their characteristics
Aligning measures to the three principle assignments
Each metric we asked participants about were coded for which of the Three Principles it may or may not apply to. For example, measuring leads and MQLs produced does not support any of the Three Principals. Measuring buying group engagement clearly measures Principle 2, aligning to buying groups. It also supports aligning to the buyer’s journey. We did not assign measuring pipeline or closed-won opportunities to any of the Principles, unless there were specifically for ABM or Target Account opportunities. We strongly support measuring the pipeline and revenue that marketing influences. We view aligning on a set of accounts with sales as a prerequisite.
| Do you measure production of… | P1 (Account Aligned) | P2 (Buying Group Aligned) | P3 (Buying Journey Aligned) |
|---|---|---|---|
| Leads Produced (Legacy) | |||
| MQLs Produced (Legacy) | |||
| MQAs | √ | √ | |
| Early-Stage Opportunities | √ | ||
| Pipeline (Legacy) | |||
| Closed-Won Deals (Legacy) | |||
| ABM Opportunities | √ | √ | |
| ABM Pipeline | √ | ||
| ABM Closed-Won Deals | √ | ||
| Accounts with Intent Detected | √ | √ | |
| Accounts Engaged on your Website | √ | √ | |
| Accounts Reached with Advertising | √ | √ | |
| Buying Group Engagement | √ | ||
| Opportunities from 3rd-Party Intent | √ | √ | |
| Uncontested Losses | √ | √ |
Statistical reporting
| Finding | Statistical Test | Statistic | Reliability Level | Effect Size | Sample Size |
|---|---|---|---|---|---|
| Sixty-four percent of marketers said that their teams have an account-based, or ABM, approach. | Descriptive Statistics | Frequency | N/A | N/A | 1332 |
| Adoption is relatively consistent across the industries we sampled – between 57% and 67% of marketing teams in Professional Services, Business Services, Financial Services, Manufacturing, and Technology have an account-based program. | Chi Square | X2=7.968 | P=.158 | X2=7.968 | 1331 |
| Private companies trail slightly behind in ABM adoption compared to companies with other funding structures. Fifty-three percent of these teams have adopted ABM compared to 60%+ among companies with venture-capital, private-equity, or public funding. | Chi Square | X2=56.4 | P<.001 | X2=56.4 | 1331 |
| Small organizations – those measuring their annual revenue in hundreds of thousands – also fall behind in ABM adoption by about 10% or more. | Chi Square | X2=7.56 | P=.023 | X2=7.56 | 1302 |
| Marketers on teams with account-based programs report reliably higher financial performance than teams without these programs. | T-test | T=-6.533 | P=.216 | Cohen’s d=0.058 | 1,331 |
| In our Measurement and Attribution study, Organizations with ABM practices tended to experience less variability in their performance, with a Coefficient of Variation (CV) of 15% – a CV considered ‘small’ in statistics – compared to 21% for non-account-based teams – a CV considered ‘moderate’ in statistics. | Coefficient of Variation (CV) | CV=15%; 21% | N/A | Small; moderate | 715 |
| Teams with account-based programs reliably rate their organizations higher on the Fair Measurement Index. | T-test | T=-2.869 | P=.004 | Cohen’s d=.099 | 713 |
| A promising 72% of organizations indicated they do prioritize accounts with multiple leads. | Descriptive Statistics | Frequency | N/A | N/A | 552 |
| Marketing teams with account-based programs reliably collect more signals than their counterparts. | T-test | T=-5.45 | P<.001 | Cohen’s d=.081 | 670 |
| ABM practitioners are more likely to collect signals that are computed, such as account or intent activity scores, than those who do not practice ABM. | T-test | T=4.770 | P<.001 | Cohen’s d=.413 | 558 |
| ABM practitioners are more likely to collect more anonymous signals than those who don’t practice ABM. | T-test | T=4.484 | P<.001 | Cohen’s d=.390 | 558 |
| There are no statistically reliable differences in the data that account-based and non-account-based teams use for contact identification. | Repeated Measures | F=1.146 | P=.333 | N2=.001 | 670 |
| CRM data is the least utilized for contact identification by both ABM and non-ABM teams. The other data sources are used at rates that are statistically equivalent. | Repeated Measures | F=8.708 | P<.001 | N2=.001 | 670 |
| There are no statistically reliable differences between ABM and non-ABM teams in tools they use for contact identification. | Repeated Measures | F=1.115 | P=.351 | N2=.001 | 670 |
| The only consistent trend is that both ABM and non-ABM teams use ABM platforms less frequently compared to CDPs, spreadsheets, and predictive analytics platforms for contact identification. | Repeated Measures | F=5.803 | P<.001 | N2=.007 | 670 |
| Although CRM data is the least utilized for contact identification, it is the most popular for account identification among both account-based and non-account-based teams. | Repeated Measures | F=13.089 | P<.001 | N2=.019 | 670 |
| There are no statistically reliable differences in the data sources used for account identification between account-based and non-account-based teams. | Repeated Measures | F=.533 | P=.777 | N2=.0001 | 670 |
| There are no statistically reliable differences in the tools used for account identification between account-based and non-account-based teams. | Repeated Measures | F=.603 | P=.720 | N=.0006 | 670 |
| The only reliable difference is that both teams use ABM platforms more frequently than spreadsheets for account identification. | Repeated Measures | F=2.94 | P=.008 | N=.003 | 670 |
| ABM practitioners are much more likely to utilize measurements associated with all three Principals than are non-ABM practitioners. | ANOVA | F=19.46 | P<.001 | N2=.007 | 715 |
| Those with an ABM practice report using three to four tools while non-account-based organizations use about two. | T-test | T=-8.429 | P<.001 | Cohen’s d= -.754 | 715 |
| Spreadsheets, CRM systems, and sales engagement platforms are the top choices among ABM teams, with each being utilized by approximately half of them to track their contribution to revenue. | Repeated Measures | F=12.648 | P<.001 | N2=.013 | 712 |
| Non-ABM organizations tend to rely more on Sourced metrics. | Chi-square | X2=16.8 | P<.001 | X2=16.8 | 715 |
| Ninety percent of our audience reported that their organizations measure marketing’s return on investment (ROI). | Descriptive Statistics | Frequency | N/A | N/A | 716 |
| Account-based teams are much more likely to report Program-Level ROI than those that do not have an ABM program. | Chi-Square Test | X2=22.76 | P<.001 | X2=22.76 | 651 |
| Account-based teams also regard the measurement of ROI as more important to their organizations than non-account-based teams. | T-test | T=-2.186 | P=.029 | Cohen’s d= 0.114 | 646 |
| Venture Capital (VC) backed companies are more likely to report marketing ROI at the program level. | Chi-Square | X2=7.67 | P=.05 | X2=7.67 | 651 |
| When examining the two variables (company funding and having an ABM practice) together in a logistic regression predicting the likelihood of reporting program-level ROI, only having an ABM practice increased the odds of reporting marketing ROI. | Logistic Regression | X2=50.58 | P<.001 | X2=50.58 | 708 |
| Eighty-three percent of marketers in our sample indicated that their organization employs a funnel or waterfall model incorporating pre-sales activities. | Descriptive Statistics | Frequency | N/A | N/A | 716 |
| Marketing teams are typically using more than one (1.8) of the four types of waterfall models we asked about. | Descriptive Statistics | Average | N/A | N/A | 593 |
| Account-based marketing teams are slightly more likely to use two waterfall models (1.9 average) than teams without an account-based approach (1.3 models). | T-Test | T=-6.094 | P<.001 | Cohen’s d=-0.68 | 592 |
| Account-based marketers are more likely to adopt the account-based waterfall model than their non-account-based peers. | Chi-square test | X2=19.6 | P<.001 | X2=19.6 | 596 |
| Account-based marketers are more likely to adopt the opportunity-based waterfall model than their non-account-based peers. | Chi-square test | X2=9.97 | P=.002 | X2=9.97 | 596 |
| Account-based and non-account-based marketers are equally likely to adopt the sales-only waterfall model. | Chi-square test | X2=0.01 | P=.908 | X2=0.01 | 596 |
| Account-based and non-account-based marketers are equally likely to adopt the lead-based waterfall model. | Chi-square test | X2=1.03 | P=.309 | X2=1.03 | 596 |
| Account-based teams give similar ratings for advanced waterfall models as their peers using leads-based or sales-only funnels. | Repeated Measures | F=.797 | P=.373 | N2=.004 | 163 |
| Inbound, Outbound, and Account-Based Marketing (ABM) strategies each receive equivalent shares of organizations’ marketing budgets (around 30% of the total marketing budget). | Repeated Measures | F=1.824 | P=0.164 | N2=.02 | 91 |