
Summary and key findings
Summary
While ABM adoption is increasing, measurement practices are lagging, with most marketers still relying on traditional metrics such as leads and MQLs. This reveals a lack of alignment between what marketers are doing (ABM) and what they are measuring. Despite this, there are signs of progress, such as increased measurement of buying group engagement and opportunities from 3rd-party intent signals – measures highly aligned with the Three Principles of Modern Marketing.
Still, these measures aren’t often making it to the board and senior leadership levels. And, marketers also value basic measures like leads and MQLs just as much as those aligned with the Three Principles.
In this report, we discuss the following, among much else:
- metrics marketers use to measure their contribution to revenue,
- tools marketers use to track and report on them,
- whether they use pre-sales waterfall models or sales funnels,
- how they apply attribution to these measures through sourced and influenced conversions,
- and how marketers feel about the way they are measured.
Key findings
- 82% of teams have adopted account-based marketing (ABM).
- Several measures strongly aligned with the Three Principles of Modern Marketing have seen significant adoption increases and are now the most utilized overall, indicating a positive shift in metric prioritization.
- While there has been a shift toward more advanced measures aligned with the Three Principles, most teams measure half or fewer of the available metrics that align with these principles.
- Of the metrics we asked marketers about, just two to three are reported to the board and about one to two of those metrics align to at least one of the Three Principles.
- Fifty-seven percent of marketers use both sourced and influenced attribution measures, with non-account-based teams favoring sourced metrics.
- ABM practitioners are more likely to use advanced waterfall models but rate their importance similar to simpler models. Non-account-based teams rate opportunity-based funnels considerably higher than all others, while only 33% of non-ABM teams use them.
- Marketers are now more likely to use a multi-touch approach than either first- or last-touch, which are used equally. Like last year, most marketers do not use advanced analytics to measure attribution.
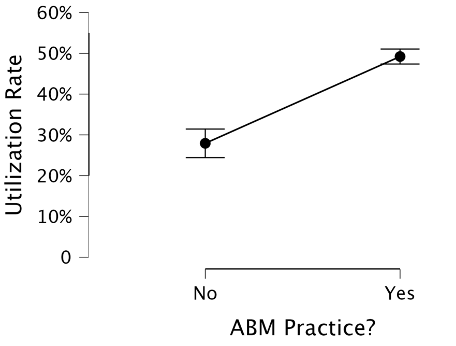
- Under 25% rate their marketing measurement practices as fair. Those using an account-based approach, however, are more likely to give a higher fairness rating. This is partly because these teams typically engage in more extensive measurement practices.
- For measurement tracking and reporting, marketers primarily use CRM systems, spreadsheets, and sales engagement platforms.
- Although 90% report marketing ROI, ABM-led organizations are notably more diligent in measuring it than their non-ABM counterparts.
Introduction
Virtually every businessperson knows the cliché, “You have to inspect what you expect.
A variant of that, “You can’t manage what you don’t measure,” supports the same concept.
When you are trying to produce a specific outcome, you must measure that outcome, as well as the processes and milestones that precede the ultimate result. And yet, for the second year in a row, we find that there is significant misalignment between what B2B marketers are doing and what they are measuring: marketers are measuring ultimate outcomes, such as revenue and ROI, but are not measuring the meaningful milestones leading up to those outcomes.
The Three Principles of modern marketing
Last year, we introduced two key principles that lie at the heart of effective modern marketing practices. This year, we add a third:
Principle 1: Marketing and sales must focus efforts against a mutually agreed-upon set of accounts.
Principle 1 holds that marketing and sales should focus their time, attention, and budgets on mutually agreed-upon cohorts of accounts, which are assessed to be the best-fit prospects to become profitable customers. This principle forms the backbone of account-centric or account-based practices (hereafter referred to as “ABM” or the “ABM approach”). Principle 1 should hold for every B2B organization. Marketing and sales simply must be aligned on the definition of good fit prospects.
Principle 2: Revenue team processes must be to be tuned to identify and engage Buying Groups, Not Just Individuals.
B2B buyers are groups, not individuals, such that the key to effectively identifying in-market buyers is to recognize and respond effectively to signals that buying groups – not just individuals – are actively researching solutions. Our Buyer Research Study found that 92% of B2B buying is done by groups of 3 or more, and 65% of buying is done by groups of 5 or more. Identifying and responding to signals that indicate interested groups is critical to optimizing B2B revenue generation.
Principle 3: Revenue teams must monitor buying groups from each of their targeted accounts throughout their entire buying journeys.
Our recent research on B2B buying processes shows that the typical B2B buying team is having more than 4,000 digital and human interactions over the course of their buying journey, and that they have chosen a preferred vendor prior to speaking with sellers. As a result, we have introduced a third principle, emphasizing the need to measure buying groups and anonymous behavior throughout their entire buying journeys.
Most buyers (84%) have already selected their preferred vendor before contacting sellers, which happens over two-thirds of the way through their buying journey. This underscores the need to monitor and engage buying groups digitally throughout the entire buying journey.
Last year we found that marketers were likely to be employing go-to-market strategies that are consistent with these principles, but much less likely to use measurement strategies that were. We are back again this year to understand how the adoption of modern measurement practices consistent with our Three Principles are trending.
Mapping principles to measures in our study
We asked participants to tell us whether they use each of 15 metrics listed below. Each metric was coded for which of the Three Principles it supports. For example, measuring buying group engagement clearly measures the second principle, aligning to buying groups. It also supports aligning to the buyer’s journey.
Metrics like leads and MQLs produced, which do not support any of the Three Principles, were classified as “legacy measures”. We strongly support measuring the pipeline and revenue that marketing influences, but we did not assign measuring pipeline or closed-won opportunities to any of the principles, unless they were specifically for ABM or Target Account opportunities. We do this because of Principle 1: we view aligning on a set of accounts with sales as a prerequisite to success in B2B.
| Do you measure production of… | P1 (Account Aligned) | P2 (Buying Group Aligned) | P3 (Buying Journey Aligned) |
|---|---|---|---|
| Leads (Legacy) | |||
| MQLs (Legacy) | |||
| Pipeline (Legacy) | |||
| Closed-Won (Legacy) | |||
| MQAs | √ | √ | |
| Early-Stage Opportunities | √ | ||
| ABM Opportunities | √ | √ | |
| ABM Pipeline | √ | ||
| ABM Closed-Won Deals | √ | ||
| Accounts with Intent | √ | √ | |
| Accounts Engaged with Your Website Content | √ | √ | |
| Buying Group Engagement | √ | ||
| Opportunities from 3rd-Party Intent | √ | √ | |
| Uncontested Losses | √ | √ |
How marketers measure their efforts
Marketers measurement practices have shifted
Last year, marketers reported tracking between six and seven (6.4) of the 14 metrics we asked about. This year, they are tracking just under seven (6.8) of the 15 metrics we surveyed. While the difference in the average number of metrics tracked between this year and last is statistically reliable, it is modest and ultimately insignificant. However, there have been a few positive shifts in the types of metrics that teams are focusing on.
What has shifted?
Four of the 15 measures included in the survey were designated as “legacy measures”. These include metrics such as MQLs and leads produced, which are not aligned with any of the Three Principles. Each of these legacy measures has seen a decrease in adoption by 10% to 18%.
Several metrics that are aligned with at least one of the Three Principles have also seen declines, most by 10% or less. Two—accounts with intent detected and accounts reached with advertising – have seen larger decreases.
However, several measures strongly aligned with the Three Principles have not only seen significant increases in adoption but are now the most utilized metrics overall, marking a positive shift in metric prioritization.
| Measure Name | Aligned Principles | 2023 | 2024 | Difference |
|---|---|---|---|---|
| Leads Produced* | None – Legacy | 63.6% | 49.0% | -14.6% |
| Marketing Qualified Leads* | None – Legacy | 72.0% | 55.3% | -16.7% |
| Pipeline Opportunities* | None – Legacy | 56.6% | 38.8% | -17.8% |
| Closed-Won Deals* | None – Legacy | 59.3% | 50.6% | -8.7% |
| Marketing Qualified Accounts | P1 | – | 45.4% | – |
| Early-stage opportunities | P3 | 39.2% | 35.2% | -4% |
| ABM/Target Account Opportunities* | P1, P3 | 43.1% | 33.1% | -10% |
| ABM/Target Account Pipeline | P1 | 34.9% | 31.4% | -3.5% |
| ABM/Target Account Closed-Won Deals | P1 | 25.0% | 29.6% | +4.6% |
| Accounts with Intent Detected* | P2, P3 | 57.0% | 29.3% | -27.7% |
| Accounts Engaged with Your Website Content | P2, P3 | 55.4% | 47.6% | -7.8% |
| Accounts Reached with Advertising* | P2, P3 | 65.8% | 47.1% | -18.7% |
| Buying Group Engagement* | P2 | 54.1% | 78.7% | +24.6% |
| Opportunities from 3rd Party Intent Signals | P2, P3 | 61.6% | 74.1% | +12.5% |
| Uncontested Losses* | P1, P3 | 42.8% | 63.4% | +20.65% |
| * Indicates a statistically reliable difference |
Three of the most advanced measures are the most common measures – among ABM practitioners
With 84% of buyers picking a favored vendor before talking to sales, it is clearer than ever that organizations must use intent data to see and react to inflight buying processes as early in their lifecycles as possible. This means identifying buyers with intent, and, of course, measuring that. Similarly, when organizations focus efforts on a targeted set of accounts, it is important to measure whether opportunities, pipeline and wins are produced from them. It is also important to measure whether opportunities are lost within that targeted set of accounts. It is particularly important for marketing to measure as carefully as possible how many deals went to competitors, which were not contested. Finally, because the buyer in B2B is a group, not an individual, measuring the engagement of buying groups is a far better measure of buyer engagement than is the measurement of individual engagement (e.g., leads, MQLs).
We were pleased to see that all three of these advanced metrics are used by a majority of marketers. This represents a substantial gain over the recent past. Nearly 40% of all organizations in our sample measure all three. Individual adoption rates of these measures can be seen in the figure below.

Teams measure half or fewer of available metrics aligned with the Three Principles
While there has been a shift toward more advanced measures aligned with the Three Principles, the chart below shows that that most teams measure half or fewer of the available metrics that align with these principles. Of the three, the least-adopted measures are those concerning Principle 1, alignment on accounts. This is surprising given the widespread adoption of ABM.
As we noted last year, marketers are doing one thing (ABM), but measuring another – leads. Still, we are pleased that organizations have adopted half of the buying group-related measures (Principle 2) and over 44% of the buying journey-related metrics (Principle 3).

What influences the metrics that marketers measure?
There are several factors we might expect to influence the metrics marketing teams measure. However, in our analysis, many of the typical firmographic variables (e.g., industry, company size, discipline of marketer) had no meaningful impact difference in the types of attributes marketers measure.
However, the type of funding an organization relies on (private, public, etc.) had a reliable impact on some of the measures. Venture capital (VC)-backed marketing teams, who are also among those more likely to have an ABM program, are more inclined to measure closed won deals and ABM/Target Account Opportunities.

Teams with account-based marketing (ABM) practices measure nearly 50% more metrics than those without, averaging just over five (5.2) metrics compared to under four (3.4) for teams without ABM. Account-based teams are much more likely to use both ABM-specific measures – such as ABM/Target account opportunities pipeline and closed-won deals – and the other measures associated with Principles 1 through 3.
Despite measuring more rigorously than ABM teams, ABM-led organizations still have considerable room for improvement within their own practices. For example, 38.6% of account-based marketers measure ABM/Target account opportunities compared to 7.8% of their peers, however 38.6% still falls well behind the adoption rate of an ABM practice itself (82%).
This discrepancy between the adoption of ABM and those measuring ABM-related outcomes is even more substantial than what we found surveying our community last year. What remains similar is that ABM organizations are also just as likely as non-ABM organizations to measure lead centric measures such as MQLs and leads produced. Account-based teams are simply adding frameworks aligned to the Three Principles to their existing suite of traditional practices rather than leaving behind what no longer serves them.
Despite mounting evidence that prioritizing individual leads is a failed approach (see our report, The Lead-based Approach Has Failed Us), marketing measurement is still focused on leads.
We encourage readers to explore the interactive chart below for customized views of how measurement varies across teams depending on their funding, ABM status, and more.

Marketers overlook the significance of measures related to Principles 1- 3
Next, we look at both how marketers use metrics and their opinion of them. Here, we see that account-centric measures (highlighted in the red box below) are not being utilized or considered as important as we would hope. With 82% of marketing organizations practicing account-centric practices, we should see these measures much higher on the scales of both usage and importance.

Figure 6 indicates clearly that while marketers are adopting account-based practices, their measurement practices lag behind. This lag is likely in part due to a lag in what senior company leadership is familiar with and wants reported. It is also likely in part due to marketers not yet believing the more advanced measures serve their purposes as well as the old. Lead-centric measures like leads produced and marketing qualified leads (MQLs) continue to dominate in terms of both usage and importance ratings. In other words, many marketers are still doing one thing (ABM) but measuring another (lead-based demand generation).
It’s worth noting that one’s level in an organization did not meaningfully impact marketers’ importance ratings, indicating a widespread need for a shift in perspective regarding the significance of various metrics, from top management to frontline staff.
Readers are encouraged to explore how the measures’ importance ratings vary across industries using the interactive table below.
https://public.tableau.com/views/2024MeasurementSentiment/Dashboard1?:embed=y&:showVizHome=no&:host_url=https%3A%2F%2Fpublic.tableau.com%2F&:embed_code_version=3&:tabs=no&:toolbar=yes&:animate_transition=yes&:display_static_image=no&:display_spinner=no&:display_overlay=yes&:display_count=yes&:language=en-US&:loadOrderID=1
Tools marketers use to measure their efforts
Marketers use more than one tool, but the number depends on whether they do ABM
The average marketing team employs multiple tools for measuring and reporting. Those with an ABM practice report using three to four tools while non-account-based organizations use about two.

The three most used tools are spreadsheets, CRM (Customer Relationship Management) systems, and sales engagement platforms (SEPs), with spreadsheets being the most widely used among those who do not have an ABM practice.

Users rate their reporting tools as very important
Spreadsheets, CRM systems, and sales engagement platforms stand out as the most widely used tools among marketers. However, their prevalence may be driven more by availability than by preference. Marketers tend to rate all the tools we surveyed similarly. These minor differences in usage are not meaningfully different from one another.

Subjectively, tools are all the same; Objectively, they may differ

All the tools we asked marketers about, from spreadsheets to commercial attribution tools, were considered equally valuable. If a marketer is using a tool, they find it valuable. To explore whether the choice of tools teams use offers insights into the practices and desired outcomes within their organizations, we analyzed whether tool use was associated with a company’s financial performance.
We found that it is. For example, marketers using spreadsheets reported worse financial performance than those that use business intelligence and commercial attribution tools.
We understand that there are countless factors that influence an organization’s financial results, far beyond what we’ve covered in our study, and that using spreadsheets would not cause weaker financial performance.
It is likely that citing spreadsheets as a key performance measurement tool is a symptom of a broader lack of sophistication. Put simply, organizations that rely on spreadsheets might also tend to engage in less sophisticated practices, which, on the whole, lead to weaker performance as a company.
Understanding marketing’s role in revenue production (marketing attribution)
For more than a decade, organizations have wrestled with how to measure marketing’s impact on revenue production. There have typically been two strategies:
Marketing-sourced metrics: an attempt to identify which deals and their associated revenue were first identified or engaged (i.e., sourced) through a marketing activity.
Marketing-influenced metrics: an attempt to measure which deals were not sourced, but were nonetheless touched at some point by marketing tactics.
Both approaches are marred by subjective, dubious, or irrelevant claims about when a deal was identified, activated, or touched by marketing.
Below, we show that many organizations utilize both approaches.

One level deeper, we asked respondents to indicate whether each item their organization tracks is measured as sourced, influenced, or both. For example, if a marketing team measures opportunities produced, are they measuring opportunities that were sourced, influenced, or both? As Figure 12 shows, marketers tend to use both sourced and influenced, with equal numbers of marketers reporting use each.
Looking at individual measures
Among the specific measures, it is notable that if a marketer is measuring an outcome, it is likely that they are assessing it with both sourced and influenced measures. Marketers are more likely to measure leads and closed-won deals through sourced metrics, but more likely to measure ABM/Target Account Pipeline deals via influence metrics. Other metrics use sourced and influenced equally.

First touch, last touch, multi-touch
Among practitioners utilizing marketing sourced metrics, there are four primary varieties. These methods apply credit to interactions at different points in the buying journey. Varieties differ in which interactions are given ‘sourcing’ credit. For example:
- Does marketing claim credit for sourcing a deal because the first contact associated with the opportunity was acquired through a marketing activity (First touch)?
- Or, does marketing claim credit for the last contact, or the contact associated with the last activity, prior to delivery of a selling opportunity to sales (Last touch)?
- Or, do organizations apply credit to multiple touch points (multi-touch)?
- The final category, Statistical, applies when organizations use multivariate statistical analysis to determine how marketing touchpoints influenced the opportunities produced.
Of the four, only the Statistical method is capable of reliably identifying the true influence of marketing touches on opportunity creation and conversion. It is the only one that is consistent with This method is the least used. It is notable, however, that where ABM-specific measures are concerned, the statistical method is at parity with first- and last-touch, but registers at about half the usage of multi-touch.

As Figure 13 above indicates, marketers are now more likely to use a multi-touch approach than either first- or last-touch, which are roughly equivalent in usage. While we applaud moving past first- and last-touch approaches, most multi-touch approaches still credit only a handful of touches with influencing deals.
The data (see the Buyer Experience Study) strongly indicate that buying groups have between 100 and 200 interactions with vendors throughout their buying journeys, at least 70% of which are both digital and anonymous. To apply credit to a small handful of those, while ignoring the influence of the others, is unlikely to yield insights that will support effective decision-making.
More importantly, merely crediting form-fill interactions fails to account for the 70% to 80% of prospect interactions that are anonymous. This renders any conclusions based solely on form-fill lead based attribution – whether first, last, or multi-touch – highly suspect at best.
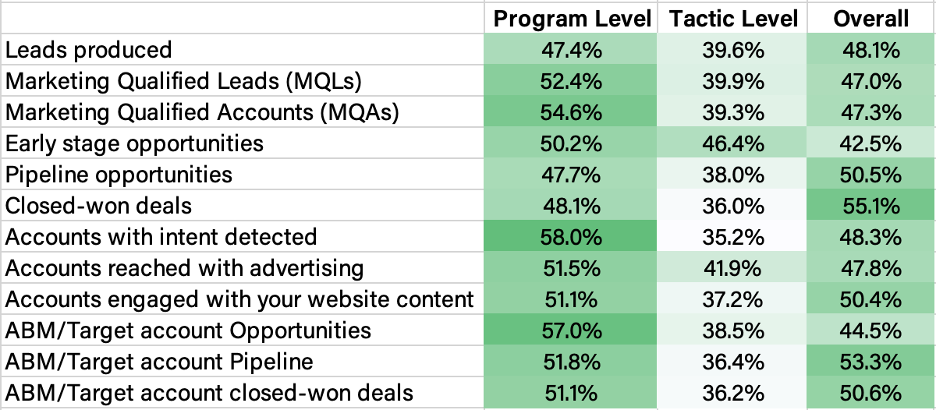
Influenced conversions: tactic, program, or overall
Like the various types of sourced metrics, marketing teams employ different approaches to assess campaign influence. While sourced metrics focus on crediting specific interactions, the evaluation of marketing influence entails examining the broader impact of marketing efforts. This examination may occur at three different levels:
- Program level: Marketing programs involve multiple tactics (see below), and typically have a central theme and objective, which align with the business’s goals, such as drive pipeline for net new customers. Marketers assess the effectiveness of entire marketing programs, such as combinations of email sequences and social media advertising efforts. Here, they are looking at the collective impact of the program(s) on various metrics without breaking down the analysis into individual strategies or tactics.
- Tactic level: At the tactic level, marketers evaluate the contribution of specific components of marketing programs. For example, a marketing program may include an email sequence and an advertising campaign delivered to the same audience. The email sequence and advertising campaign are tactics within the program.
- Overall: At this level, marketers assess the combined contribution of all marketing efforts across various channels and programs to each metric. In this approach, marketers do not necessarily attribute success to specific programs or tactics but rather consider the cumulative effect of all marketing activities on the outcomes they’re measuring.
The heatmap below illustrates that marketing teams predominantly analyze marketing influence at either the program or overall level. The presence or absence of an ABM practice does not significantly alter this approach for the metrics listed below. Across the board, marketers appear to favor program or overall level reporting for assessing influence conversions.
Marketing ROI
Ninety percent of our audience reported measuring marketing return on investment (ROI). We also asked marketers whether they report marketing ROI at the program, tactic, or overall contribution level. Fifteen percent of marketers measure ROI at all three levels. Among those measuring at one level, marketers are slightly more likely to measure the ROI of marketing as a whole than they are to measure ROI at the program level.

Which metrics are reported to the board and senior leadership?
Organizations are often required to focus heavily on optimizing metrics that are reported to the board of directors. And many marketing leaders ‘work backwards’ from board meetings, meaning they build their quarterly priorities around optimizing results that are reported to the Board. As a result, what is reported to the board can meaningfully influence what organizations focus on in their go-to-market strategies. Forty-two percent of our sample reports at least one metric to the Board, but most report two to three (2.4).
This year’s data show that organizations are focused largely on the bottom line for marketing – closed-won deals that marketing has sourced or influenced (per the highly flawed measurement methods indicated above). Marketers also report the early-stage opportunities that precede closed-won deals.
Surprisingly, marketing is reporting how many accounts are engaged on the website at a higher rate than pipeline or MQLs. We applaud the reporting of this metric but are nonetheless surprised that it would register reliably ahead of pipeline produced. It is worth noting, however, that there is substantial variability. We are very pleased to find that MQLs and Leads are clearly second-tier metrics for reporting to the board.
Of the two to three (2.4) metrics that most organizations report to the board, one to two (1.5) are likely to be metrics that align to at least one of the Three Principles. However, it’s important to note that this represents a fraction of potential metrics. Of twelve metrics we asked marketers, just two to three get reported to the board and about one to two of those are metrics aligning to at least one of the Three Principles. Metrics related to Principle 3, which focuses on understanding the entire buyer’s journey, are reported more frequently, yet still account for only about 10% of all available metrics under this principle.

Waterfall models
Organizations are using multiple funnel or waterfall models

Waterfall models are structured frameworks that outline the relationship between buyer and seller. These models provide organizations with a systematic approach to track an organization’s progress against a set of selling opportunities. Some Waterfall or funnel models track stages starting with the first interactions of sellers with buyers. Others reach further back in time to measure pre-sales milestones – the relationship from the time a set of accounts is targeted through to the time sales begins working an opportunity.
Eighty-three percent of marketers in our sample indicated that their organization employs a funnel or waterfall model incorporating pre-sales activities. If organizations have an account-based program, they are nearly twice as likely to do so.
Marketing teams typically use more than one (1.8 models) of the four types of waterfall models we asked about.
Account-based marketers have a higher tendency to adopt the advanced water fall models (account- and opportunity-based) than the less advanced models (leads-based and sales-only funnels). However, they do use the less advanced waterfall models at similar rates as their non-account-based peers. This reflects a gradual shift towards more sophisticated methods for account-based marketers, as they incorporate new models without fully abandoning the older ones.
The use of opportunity-based waterfalls
Surprisingly, while account-based teams have a higher tendency to adopt advanced waterfall models, they give similar ratings for these models as their peers using leads-based or sales only funnels. Among non-account-based marketers, these teams show a clear preference for opportunity-based funnels compared to their peers using the other three models, despite a relatively low adoption rate (32.8%). Thus, although not widely embraced by non-account-based organizations, the minority that does utilize this advanced waterfall method can hopefully serve as a compelling demonstration of its effectiveness to their peers.

The opportunity is ultimately the ideal currency for a Waterfall or funnel, because it is the most persistent unit of measure throughout revenue processes. Leads are virtually always converted to contacts and attached to opportunities where applicable. And, many accounts represent multiple selling opportunities. The opportunity object in CRM systems is typically capable of accommodating both marketing and sales processes.

How marketers perceive revenue measurement
Finally, given the evolving nature and complexity of measuring marketing performance that has been discussed throughout this report, we wanted to understand whether marketers felt as though the way their organizations measure performance is fair. To assess this, we asked marketers to rate their organizations’ measurement practices from 1 (unfair) to 5 (fair).
Across all marketers, the responses were as follows:
- 2.5% rated as unfair.
- 10% rated as somewhat unfair.
- 32.5% rated as neutral.
- 32% rated as somewhat fair.
- 23.4% rated as fair.
Higher fairness ratings are reliably correlated with tracking more measurements, using more tools, and employing more funnel or waterfall models.
Implications
A function in transition
Our report reflects a function in transition.
While marketers are adopting account-based practices, in most cases their measurement practices lag. Last year 72% of the marketers we surveyed had account-based marketing programs, yet their measurement focus was on traditional metrics like leads and MQLs, indicating a misalignment between strategy and measurement. This year, the gap appears to have grown even wider. Eighty-two percent have an ABM practice but 33% or fewer measure account-centric metrics.
In other words, like last year, marketers are doing one thing (ABM), but measuring another (leads and MQLs).
Legacy measures are still widely used, but the measures that have become more prominent over the past year are the most advanced measures. Those consistent with the Three Principles have made significant advances in the past year.
This disconnect between what marketing is doing (ABM) and what it is measuring (lead-based marketing) is likely due in part to a lag in what Boards and senior company leadership is familiar with and wants reported. The findings reported here also suggest that this lag is also likely in part due to marketers not yet believing the more advanced measures serve their purposes as well as the old.
To begin this report, we invoked the business maxim, you can’t manage what you don’t measure. Unfortunately, our 2025 Marketing Attribution and Contribution report finds that marketing teams are still not measuring what they are attempting to manage. Marketing teams should align measurement efforts directly with their operational activities, ensuring that metrics accurately reflect their strategic approaches.
Appendix
Methods
The survey sample
For this year’s study, we surveyed 716 marketers from a panel of B2B practitioners who are not affiliated with 6sense. This is a different audience than we sampled for this study last year. Last year, we conducted organic recruitment, putting out ads for our survey through 6sense’s social channels. Consequently, last year’s sample likely included marketers familiar with 6sense and potentially part of our community. Understanding this subset of marketers remains crucial. However, it’s equally important to grasp the broader landscape of B2B marketing practices. Thus, sampling from a panel of B2B practitioners unassociated with 6sense this year ensured that our data more accurately reflected the diverse B2B marketing landscape.
To understand whether there might be other factors at work causing differences in ABM adoption, we tested a wide variety of firmographic and demographic factors, including the marketer’s discipline within marketing, company size, industry, and more. These factors did not influence the year-over-year difference we observed.
What we cannot say, however, is that these changes are due to a change over time. Next year, we will collect data to do a time-wise comparison for both groups.
Statistical reporting
| Finding | Statistical Test | Statistic | Reliability Level | Effect Size | Sample Size |
|---|---|---|---|---|---|
| Marketers measure slightly fewer than seven attributes. | Average | N/A | N/A | N/A | 716 |
| The difference in the average number of metrics tracked between this year (6.8) and last (6.4) is statistically reliable. However, it is modest and ultimately insignificant. | T-test | T=-1.819 | P=.06 | Cohen’s d= -0.112 | 1,112 |
| Fewer marketers are measuring Leads Produced this year (49%) compared to last (63%). | T-test | T=4.486 | P<.001 | Cohen’s d= 0.296 | 1,048 |
| Fewer marketers are measuring Leads Produced this year (72%) compared to last (55%). | T-test | T=5.398 | P<.001 | Cohen’s d= 0.352 | 1,048 |
| The change in the number of marketers measuring Early-Stage Opportunities from last year to this year is not statistically reliable. | T-test | T=1.229 | P=.216 | Cohen’s d = 0.082 | 1,048 |
| Fewer marketers are measuring pipeline opportunities this year (38%) compared to last (56%). | T-test | T=5.431 | P<.001 | Cohen’s d= 0.362 | 1,048 |
| Fewer marketers are measuring Closed- Won Deals this year (59%) compared to last (50%). | T-test | T=2.67 | P=.008 | Cohen’s d= 0.177 | 1,048 |
| Fewer marketers are measuring Accounts with Intent Detected this year (57%) compared to last (29%). | T-test | T=9.149 | P<.001 | Cohen’s d= 0.580 | 1,111 |
| Fewer marketers are measuring Accounts Reached with Ads this year (65%) compared to last (47%). | T-test | T=6.18 | P<.001 | Cohen’s d= 0.382 | 1,111 |
| Fewer marketers are measuring Accounts Engaged with Website Content this year (55%) compared to last (47%). | T-test | T=2.502 | P=.013 | Cohen’s d= 0.157 | 1,111 |
| Fewer marketers are measuring ABM/Target Account Opportunities this year (43%) compared to last (33%). | T-test | T=3.07 | P=.002 | Cohen’s d= 0.206 | 1,048 |
| The change in the number of marketers measuring ABM/Target Account Pipeline from last year to this year is not statistically reliable. | T-test | T=1.118 | P=.259 | Cohen’s d= .075 | 1,048 |
| The change in the number of marketers measuring ABM/Target Account Closed-Won Deals from last year to this year is not statistically reliable. | T-test | T=-1.574 | P=.116 | Cohen’s d= .116 | 1,048 |
| More marketers measure Third Party Intent Signals this year (74%) compared to last (61%). | T-test | T=-3.896 | P<.001 | Cohen’s d= -.27 | 942 |
| More marketers measure Uncontested Losses this year (63%) compared to last (42%). | T-test | T=-6.087 | P<.001 | Cohen’s d= -.42 | 940 |
| More marketers measure Group Level Engagement this year (78%) compared to last (54%). | T-test | T=-7.919 | P<.001 | Cohen’s d= -.53 | 993 |
| Overall adoption of measures that align to the Three Principles remains at or below 50%. | Frequency | N/A | N/A | N/A | 716 |
| In our analysis, industry (tech & software, manufacturing, etc.) did not make a meaningful difference in the types of attributes marketers measure. | Repeated Measures ANOVA | F=2.634 | P=.02 (Differences were not reliable across industries, only between measures themselves) | N/A | 715 |
| The specific role of the marketer participating in our study (Content Marketing, Brand Marketing, Customer Marketing, etc.) did not make a difference in the types of attributes they measure. | Repeated Measures ANOVA | F=1.07 | P=.383 | N/A | 715 |
| Venture capital (VC) backed marketing teams are more likely to measure closed won deals. | T-test | T=-2.700 | P=.007 | Cohen’s d= -.219 | 1,047 |
| Venture capital (VC) backed marketing teams are more likely to measure ABM/Target Account Opportunities. | T-test | T=-10.521 | P<.001 | Cohen’s d= -.730 | 1,047 |
| 82% of marketers in our sample said that their teams have an account-based, or ABM, approach. | Frequency | N/A | N/A | N/A | 716 |
| Those with an ABM practice are much more likely to measure ABM-specific measures, such as ABM/Target account opportunities, pipeline, and closed-won deals. However, they are just as likely as non-ABM organizations to measure lead-centric measures such as MQLs and leads produced. ABM organizations are also much more likely to track – pipeline opportunities identified through third-party intent signals, deals that go to competitors uncontested, and buying group level engagement – than their non-ABM counterparts. | Repeated Measures | F=7.951 | P<.001 | N2=.011 | 532 |
| Early-stage opportunities, Closed-Won deals, and ABM/Target Account Opportunities are all rated statistically higher than Pipeline. All other differences in usefulness ratings are not statistically reliable. | Repeated Measures | F=2.972 | P=.005 | N2=.074 | 38 |
| ABM and non-ABM organizations value measures all the same. | Repeated Measures | F=1.102 | P=.301 | N2=.007 | 38 |
| One’s level in an organization did not meaningfully impact marketers’ importance ratings, indicating a widespread need for a shift in perspective regarding the significance of various metrics. | Repeated Measures | F=.973 | P=.417 | N2=.034 | 28 |
| Those with an ABM practice report using three to four tools while non-account based organizations use about two. | T-test | T=-8.429 | P<.001 | Cohen’s d= -.754 | 715 |
| The three most used tools are spreadsheets, CRM (Customer Relationship Management) systems, and sales engagement platforms (SEPs). | Repeated Measures | F=48.1 | P<.001 | N2=.063 | 713 |
| Among those who don’t have an account-based practice, spreadsheets clearly dominate. While 53% of ABM teams use spreadsheets, a whopping 70% of those who don’t have an ABM practice rely on them. The next most prevalent tool among non-ABM practitioners are CRM systems, used by just 43.3%. | Repeated Measures | F=12.648 | P<.001 | N2=.013 | 712 |
| Marketers rate all the tools we asked about more or less the same, suggesting usage may be driven by availability rather than preference. | Repeated Measures | F=1.432 | P=.197 | N2=.064 | 22 |
| Marketers are more likely to use a multi-touch approach than first- or last-touch, which are roughly equivalent in usage. | Repeated Measures | F=63.4 | P<.001 | N2=0.10 | 569 |
| Ninety percent of marketers reported that their organizations measure marketing ROI. | Frequency | N/A | N/A | N/A | 716 |
| Fifteen percent of marketers measure ROI at all three levels. | Frequency | N/A | N/A | N/A | 716 |
| Organizations are focused largely on closed won deals that marketing has sourced or influenced, as well as early-stage opportunities. | Repeated Measures | F=2.292 | P=.026 | N2=.057 | 39 |
| Mar keting is reporting how many accounts are engaged on the website at a higher rate than pipeline or MQLs. | Repeated Measures | F=2.292 | P=.026 | N2=.057 | 39 |
| Of the two to three metrics that most organizations report to the board, one to two are likely to be metrics that align to at least one of the Three Principles. | Descriptive Statistic | Average | N/A | N/A | 716 |
| Of all the Three Principles Metrics we asked about on our survey, fewer than 10% or less are reported to the Board. | Repeated Measures | F=6.838 | P=<.001 | N2=.009 | 717 |
| Metrics pertaining to Principle Number Three, pertaining to seeing the entire buyer’s journey, are reported most often. | Repeated Measures | F=6.838 | P=<.001 | N2=.009 | 717 |
| Eighty-three percent of marketers indicated that their organization employs a funnel or waterfall model incorporating pre-sales activities. | Frequency | N/A | N/A | 716 | |
| Organizations with an account-based program are more likely to have a funnel or waterfall model. | Chi-square test | X2= 108.65 | P<.001 | X2= 108.65 | 711 |
| Account-based marketers are more likely to adopt the account-based waterfall model than their non-account-based peers. | Chi-square test | X2=19.6 | P<.001 | X2=19.6 | 596 |
| Account-based marketers are more likely to adopt the opportunity-based waterfall model than their non-account-based peers. | Chi-square test | X2=9.97 | P=.002 | X2=9.97 | 596 |
| Account-based and non-account-based marketers are equally likely to adopt the sales-only waterfall model. | Chi-square test | X2=0.01 | P=.908 | X2=0.01 | 596 |
| Account-based and non-account-based marketers are equally likely to adopt the lead-based waterfall model. | Chi-square test | X2=1.03 | P=.309 | X2=1.03 | 596 |
| Account-based teams give similar ratings for advanced waterfall models as their peers using leads-based or sales-only funnels. | Repeated Measures | F=.797 | P=.373 | N2=.004 | 163 |
| Among non-account-based marketers, there is a clear preference for opportunity-based funnels compared to their peers using the other three models, despite a relatively low adoption rate. | Descriptive Statistics | Average | N/A | N/A | 716 |
| Across all marketers, 2.5% rated their organization’s measurement practices as very unfair; 10% rated as somewhat unfair; 32.5% rated as neutral; 32% rated as somewhat fair; 23.4% rated as fair. | Frequency | N/A | N/A | N/A | 716 |
| Higher fairness ratings are reliably correlated with tracking more measurements. | Correlation | R=.156 | P<.001 | small | 714 |
| Higher fairness ratings are reliably correlated with using more tools to help with measurement reporting and tracking. | Correlation | R=.155 | P<.001 | small | 714 |